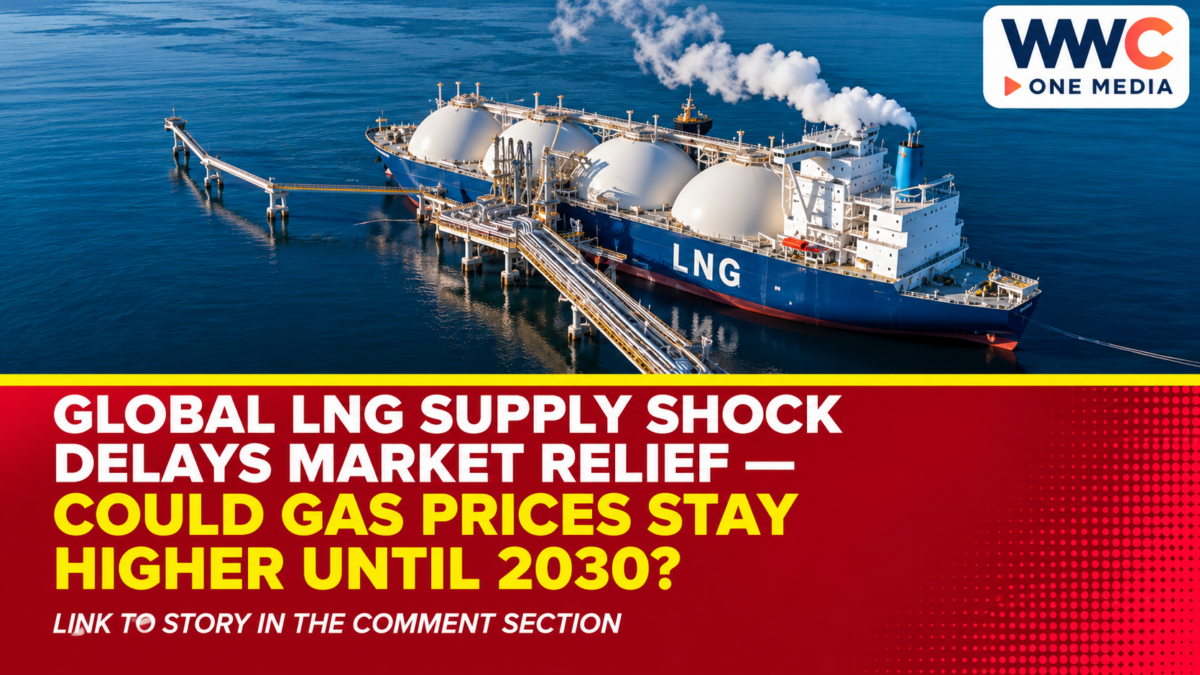
MANILA, Philippines — Global LNG supply faces a prolonged recovery after disruptions to Middle Eastern exports and liquefaction facilities cut shipments during 2026. The International Energy Agency’s latest gas-security assessment estimates that the combined effects could remove 150 billion cubic metres of LNG supply over 2026–2030, complicating expectations that new export projects would quickly ease prices.
For energy importers, the issue is not simply how many liquefaction plants are being built. It is when those plants can deliver cargoes, whether damaged facilities can resume production, and how buyers compete for shipments during the transition.
Global LNG Supply Faces a Multi-Year Shortfall
The IEA estimates that LNG loadings from Qatar and the United Arab Emirates declined by more than 60 billion cubic metres compared with a year earlier over March–October 2026. Increased supply from countries outside the Gulf partly offset that loss, but worldwide LNG production still fell by about 6% over the same period.
Under its assumption that Strait of Hormuz flows remain largely disrupted through year-end, the agency projects a 3% fall in global LNG supply in 2026. This is a conditional annual forecast, not a completed full-year measurement.
Its five-year estimate of 150 billion cubic metres represents cumulative lost supply against a counterfactual path, not an extra 150 billion cubic metres disappearing in each year. The agency puts the reduction at an amount equivalent to 15% of new LNG supply anticipated over 2026–2030.
Why it matters: A shortfall concentrated in 2026 and 2027 can delay the point at which additional export capacity starts providing meaningful relief, even if longer-term construction plans remain substantial.
The LNG Expansion Wave Has Not Disappeared
The IEA’s October 2026 capacity tracker lists more than 330 billion cubic metres per year of new LNG export capacity expected to come online over 2025–2030 from projects that had already reached final investment decisions and were under construction at the beginning of 2025.
That is prospective annual production capacity, not gas already shipped. Start-up dates, commissioning schedules and utilisation rates determine how much supply actually reaches buyers.
The tracker projects annual capacity additions from those projects to peak at roughly 90 billion cubic metres per year in 2028. It also identifies delays at Qatar’s North Field East expansion following damage to the Ras Laffan complex.
Meanwhile, new North American projects are part of the pipeline for later in the decade. The IEA’s November review identifies developments in the United States targeting 2030 production and an additional Canadian phase expected in the early 2030s.
Analysis: A large construction pipeline and a tight current market can coexist. Treating all announced capacity as immediately available would exaggerate the near-term cushion against disruption.
Energy Prices Show Why Timing Matters
The IEA calculates that European TTF spot prices averaged close to US$20 per million British thermal units from March through October, almost 70% above the comparable period a year earlier. Asian spot LNG prices averaged US$21.50 over those months, nearly 80% higher year on year.
These are period averages, not verified spot quotations for Nov. 19. They also cannot be applied directly to every long-term supply contract because indexation formulas, delivery terms and transport charges differ.
The same IEA review projects global natural gas demand to decline by about 1.5% in 2026, partly as elevated prices discourage industrial use and encourage fuel switching. Falling demand, therefore, does not necessarily signal a comfortable market; it can also reflect unaffordable supply.
WWC ONE MEDIA has examined Europe’s shrinking winter gas-storage cushion, an example of how buyers must manage inventories while facing competition for replacement cargoes.
American Exports Provide Flexibility, With Limits
The US Department of Energy recorded 514.6 billion cubic feet of American LNG exports in August 2026, reaching 33 countries. Europe received 269.3 billion cubic feet, or 52.3% of the month’s US LNG total, while Asia received 158.7 billion cubic feet.
Those shipments demonstrate the geographic reach of US supply. Yet export volumes already committed to customers cannot simply be counted as unused capacity available to fill any new shortage.
Flexible cargo destinations and a growing mix of contract-pricing arrangements may help redirect deliveries where demand is strongest. That flexibility can improve availability for some buyers while leaving others exposed to higher delivered costs.
WWC has separately explored the disruption to a Polish company’s long-term Qatar LNG contract, illustrating how physical supply interruptions can also reshape commercial procurement.
What the Global LNG Supply Squeeze Means for the Philippines
The Philippines has direct exposure to internationally traded fuel. In March, its Department of Energy instructed electricity-sector participants to conserve fuel and manage dispatch during a national energy emergency, explicitly identifying imported LNG among the country’s external energy dependencies.
In November, the department also formalised research cooperation with the Economic Research Institute for ASEAN and East Asia. The partnership includes examining small-scale LNG-to-power applications for remote islands, alongside other energy technologies.
Domestic production offers a different source of supply risk. WWC’s report on new gas production from the Malampaya field explains why indigenous resources remain relevant to the country’s generation mix.
What this could mean: Persistent international LNG tightness could raise procurement challenges for gas-dependent power producers. It does not mean every Filipino household will face a specific electricity-rate increase: power bills also depend on contract structures, generation dispatch, exchange rates and regulated charges.
What Happens Next
The key indicators are actual LNG cargo loadings from the Gulf, repairs to damaged facilities, new export-project commissioning, and the extent to which elevated prices continue suppressing demand. Updated official market reviews will help establish whether supply conditions are easing on the timetable currently anticipated.
A 2030 oversupply outcome is not proven by the available records. What they establish is a delayed easing of the market alongside a substantial capacity buildout. Until more gas is physically delivered, the expected expansion remains a forecast rather than a guarantee of cheaper fuel.
Frequently Asked Questions
Is there a global LNG shortage in 2026?
The IEA reports major disruptions to Gulf exports and forecasts a 3% decline in global LNG supply for 2026 under its stated assumptions. The severity differs across importing markets.
Will there be an LNG glut by 2030?
The official outlook documents major new capacity and delayed market relief, but it does not establish a guaranteed worldwide glut in 2030. Demand, commissioning and supply disruptions remain important uncertainties.
How much LNG supply could be lost through 2030?
The IEA estimates cumulative supply losses of 150 billion cubic metres over 2026–2030 compared with its reference outlook. That is not an annual loss of the same volume.
Why do gas prices rise when more LNG projects are under construction?
Construction does not create immediate delivered supply. Damaged facilities, restricted shipping and strong competition for available cargoes can keep markets tight before new projects reach commercial production.
Could the LNG crisis affect Philippine electricity bills?
It could affect fuel procurement costs for some generators, but no specific retail tariff change follows automatically. Local contracts, dispatch, regulation and other electricity charges also matter.