NEW YORK / WASHINGTON / MANILA — November 7, 2026 | WWC ONE MEDIA | Wall Street, Global Finance, Stock Markets and Artificial Intelligence
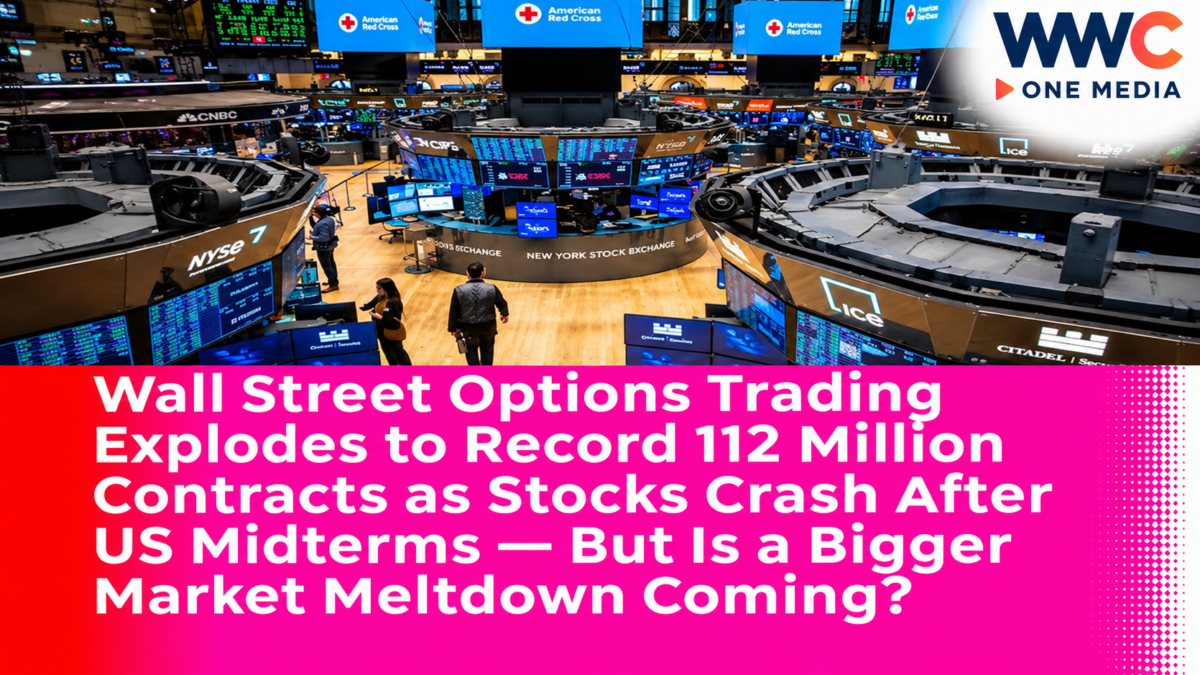
Wall Street has witnessed an extraordinary explosion in options trading as investors scrambled to protect their portfolios during one of the most violent US stock-market selloffs of 2026.
More than 112 million options contracts changed hands on Thursday, November 5, setting a new daily record for the US options market.
The unprecedented surge came as the technology-heavy Nasdaq 100 plunged approximately 6.4% and the S&P 500 tumbled 4.4%, intensifying fears that a crowded investment rush into artificial intelligence stocks was rapidly unraveling.
According to Bloomberg’s November 6 report, options activity exceeded October’s average daily trading volume by approximately 53%.
Just over half of the transactions involved put options, financial contracts that can be used to profit from falling prices or protect investments against further declines.
The rush into derivatives occurred only two days after the November 3 US midterm elections, when Democrats secured control of both chambers of Congress.
Investors initially welcomed the results, but that optimism quickly reversed as uncertainty surrounding artificial intelligence infrastructure, technology valuations and future government policy triggered aggressive selling.
The market turbulence was so severe that the Cboe Volatility Index, widely known as Wall Street’s fear gauge, surged to an eight-month high.
But Friday’s partial recovery raised another question.
Is the record-breaking options frenzy a warning that investors expect a deeper financial crisis—or could the extreme surge in fear mark the beginning of a stock-market rebound?
US Options Market Breaks All-Time Daily Trading Record
The November 5 session marked the busiest day in the history of US listed options trading.
Data reported by Bloomberg showed that more than 112 million contracts traded across the market.
That represented approximately 53% more activity than the average daily level recorded in October.
The figures were based on clearing information from the Options Clearing Corporation, which processes transactions across US listed options exchanges.
For comparison, Cboe previously reported that the options industry averaged 72.8 million contracts daily during the second quarter of 2026.
That was already a historically elevated level of activity.
The November record therefore represents an extraordinary acceleration during a period of market distress.
Options are derivatives whose value depends on an underlying security or index.
Investors use them to manage risk, express views about market direction and construct more complex trading strategies.
Unlike buying a share of stock, an options contract typically has an expiration date and may become worthless if market conditions do not develop as expected.
This means options can offer flexibility but also expose traders to significant losses.
Put Options Dominate as Investors Seek Protection
One of the clearest signs of market anxiety was the increase in put-option activity.
Options Clearing Corporation-derived figures showed approximately 57 million put contracts and 55.4 million call contracts traded on November 5.
That produced a total put-to-call volume ratio of approximately 1.03.
A put option generally gives its holder the right, but not the obligation, to sell an underlying asset at a specified price within the contract’s terms.
Investors may purchase puts when they expect stock prices to decline.
They may also buy them to protect existing portfolios.
For example, an investor holding a large position in technology stocks might purchase put options to offset part of the damage if prices fall.
However, not every put-option transaction represents a bearish bet.
Some investors sell puts to earn premiums, while market makers use options to manage exposures created by customer transactions.
The unusually high put volume is therefore evidence of heightened defensive and directional activity, not proof that every trader expects a market collapse.
Nasdaq 100 Plunges 6.4% in Post-Election Selloff
The record options activity occurred during a brutal session for technology stocks.
On November 5, the Nasdaq 100 dropped approximately 6.4%.
The broader Nasdaq Composite lost 5.5%, while the S&P 500 declined 4.4%.
According to Reuters, the Nasdaq 100’s plunge erased approximately $2.5 trillion in market capitalization.
These losses were concentrated in a market heavily influenced by companies associated with the artificial intelligence investment boom.
Technology shares had benefited from expectations that demand for AI chips, cloud computing and data centers would continue expanding rapidly.
But investors began questioning whether future earnings could justify the enormous amounts of capital being invested.
As WWC ONE MEDIA reported on Wall Street’s $3.2-trillion AI stock rout, concerns about expensive valuations and infrastructure spending helped turn a technology-led rally into an aggressive selloff.
The options-market record illustrates how quickly those concerns translated into demand for financial protection.
Democratic Midterm Victory Triggers an Unexpected Market Reversal
The November 3 midterm elections created an important political backdrop.
Democrats secured control of the incoming House and Senate, delivering a major setback to President Donald Trump’s Republican Party.
The initial market reaction was positive.
Some investors believed a Democratic-controlled Congress might restrain certain Trump administration policies and reduce political uncertainty.
But optimism did not last.
By Thursday, traders were reassessing the potential implications of greater congressional scrutiny of technology companies and AI infrastructure projects.
As WWC ONE MEDIA previously reported on the Democratic takeover of Congress, the election changed the legislative balance of power in Washington.
The shift could influence future debates involving trade, government spending, technology regulation and data-center development.
However, it would be inaccurate to claim that the election alone caused every market loss.
The selloff also reflected concentrated technology positions, valuation concerns and trading strategies that can amplify sudden price movements.
No nationwide prohibition on AI investment or data-center construction automatically resulted from the election.
Wall Street’s Fear Gauge Surges to Eight-Month High
The Cboe Volatility Index, or VIX, became another important indicator of market stress.
Reuters reported that the VIX surged to an intraday high of 28.36 on November 5, its highest level in eight months.
The index is derived from S&P 500 options prices and reflects market expectations for volatility over approximately the next 30 days.
A rising VIX generally indicates that investors expect larger market fluctuations.
But it does not directly predict whether stock prices will rise or fall.
Volatility can increase during both severe declines and rapid rebounds.
The November spike reflected the sharp increase in demand for protection and the uncertainty surrounding equity prices.
Reuters reported that the cost of downside protection rose to roughly twice normal levels during the selloff.
That creates a difficult problem for investors.
Hedging becomes more expensive precisely when market participants are most anxious about potential losses.
Investors who wait until panic is widespread may therefore pay substantially more for protection than they would during calmer conditions.
Goldman Sachs’ Panic Indicator Flashes an Extreme Reading
Another dramatic signal came from Goldman Sachs.
According to a November 6 Bloomberg report, the firm’s proprietary Vol Panic Index surged to 9.57 out of 10 during Thursday’s trading.
The indicator crossed the 9.5 threshold that Goldman Sachs identifies as an extreme panic zone.
The increase was among the largest one-day jumps in the indicator’s history.
Goldman Sachs traders also reported an unusually large two-day swing in the measure as the market moved from post-election optimism to widespread anxiety.
The bank’s analysis suggested that extreme panic readings have sometimes preceded stronger returns over subsequent periods.
But historical patterns are not guarantees.
A market can rebound after an episode of panic, continue declining or experience further volatility before stabilizing.
The indicator therefore provides context about investor positioning and sentiment rather than a reliable signal to buy stocks immediately.
Crowded AI Trades Create a Dangerous Chain Reaction
The market decline was intensified by the concentration of investor exposure to AI-related companies.
For months, hedge funds and other institutions had invested heavily in technology businesses expected to benefit from growing demand for advanced computing.
When concerns emerged about spending, regulation and profitability, multiple investors attempted to reduce their positions.
That can create a chain reaction.
As large investors sell, share prices fall.
Those declines can trigger additional risk controls or margin requirements for other investors.
Some automated investment strategies may also reduce stock exposure when volatility increases.
Reuters reported that Nomura estimated leveraged exchange-traded products could sell approximately $47 billion in equities near the November 5 closing session.
That was a projected trading-flow estimate, not a confirmed tally of completed sales.
The combination of investor selling, derivative hedging and systematic risk reduction can make an already weak market decline more severe.
It is one reason exceptionally high options activity can accompany sudden stock-market turmoil.
Hedge Funds Face Heavy Losses as the AI Trade Unwinds
The pressure was not limited to retail investors.
Professional investment managers also faced substantial losses.
Reuters reported that technology-focused long/short hedge funds were among the hardest hit during Thursday’s selloff.
Some managers reduced leverage or closed positions to control risk.
The developments came as Walleye Capital announced plans to return approximately $2 billion to clients while restructuring parts of its internal stock-trading business.
Walleye’s decision reflects its own investment performance and strategic priorities.
It should not be interpreted as evidence that the record options volume directly caused the firm’s restructuring.
Nevertheless, the two developments illustrate the pressure facing investment managers during volatile markets.
Hedge funds use different trading strategies, but many remain exposed to sudden shifts in stock prices, financing costs and market liquidity.
When several strategies experience losses simultaneously, managers may need to reassess their exposure.
The danger increases when institutions hold similar positions and attempt to exit them at the same time.
The Record Reflects Years of Growth in Options Trading
Although the November 5 surge was extraordinary, options trading had already been expanding rapidly.
Cboe reported that industrywide average daily options volume reached 72.8 million contracts in the second quarter of 2026, an increase of more than 19% from a year earlier.
The growth has been supported by electronic trading, increased retail participation and expanding use of options linked to exchange-traded funds and stock indexes.
Another important development has been the popularity of zero-days-to-expiration options, commonly called 0DTE options.
These contracts expire on the same trading day.
They allow traders to express short-term market views or manage intraday risk.
However, their short lifespan can make them particularly sensitive to rapid changes in asset prices.
Cboe reported that average daily trading in its S&P 500 Index 0DTE options reached a monthly record of 3.6 million contracts in October.
That figure illustrates how important very short-term derivatives have become.
But the November 5 industrywide record included many different types of options.
It should not be described as consisting entirely of 0DTE trading.
Are Options Making Stock Market Crashes Worse?
The relationship between options activity and stock-market volatility is complicated.
Options can help investors transfer risk.
A portfolio manager may purchase protection against a sharp decline, reducing the need to sell an entire stock position.
That can support more orderly risk management.
But certain hedging arrangements may also contribute to short-term market movements.
Options market makers frequently adjust their exposure by trading the underlying stocks or futures.
Depending on the direction and structure of their positions, those adjustments can either stabilize or amplify market changes.
Automated strategies and leveraged products can add further complexity.
Therefore, record options volume does not automatically mean derivatives caused the market crash.
The same data can reflect investors reacting to volatility rather than generating it.
Establishing causation would require more detailed analysis of positions, market-maker hedging and trading flows.
The safer conclusion is that options markets became an important center of activity as investors responded to the selloff.
Friday’s Rebound Shows Why Panic Is Not a Forecast
Wall Street’s reaction on Friday, November 6, demonstrated how quickly market sentiment can change.
The S&P 500 gained approximately 0.3%, closing at 7,376.86.
The Nasdaq Composite recovered about 1.1%, finishing at 24,579.42.
However, the Dow Jones Industrial Average declined approximately 0.5%.
The recovery was therefore uneven.
According to the Associated Press, the major US indexes still finished the week lower despite Friday’s stabilization.
The Nasdaq declined approximately 3.4% for the week, while the S&P 500 lost around 2.7%.
The rebound did not erase Thursday’s damage.
But it demonstrated that a period of extreme fear does not necessarily lead to continuous declines.
Some investors use sharp selloffs as opportunities to purchase shares at lower valuations.
Others remain cautious because the underlying concerns about earnings, leverage and AI investment have not disappeared.
The next direction will depend on company fundamentals, economic data and market expectations.
Asian Stock Markets Feel the Shock
The turbulence extended beyond the United States.
Asian stock markets experienced sharp declines on November 6 as investors reassessed technology valuations and semiconductor demand.
South Korea’s KOSPI fell sharply enough during early trading to trigger a temporary trading halt.
Japan’s Nikkei and Taiwan’s stock market also suffered substantial losses.
As WWC ONE MEDIA reported on the selloff spreading across Asian semiconductor markets, the region’s dependence on global AI infrastructure spending makes it vulnerable to changes in US technology investment.
The impact is particularly important for suppliers of memory chips, semiconductor equipment and advanced computing components.
If American technology companies slow their spending, Asian suppliers could experience weaker demand.
However, a stock-market decline does not automatically establish that technology orders have already collapsed.
The selloff reflects changing expectations about future earnings and investment returns.
What This Means for Investors in the Philippines
The record-breaking options activity offers several lessons for Philippine investors.
First, financial-market volatility can increase suddenly even after an initial positive reaction to political events.
Second, sophisticated investment products do not eliminate market risk.
Options can protect portfolios, but they can also generate substantial losses if used without appropriate risk management.
Third, the performance of US technology stocks can influence markets across Asia.
Philippine investors holding international equity funds or US technology shares may be exposed to those movements.
The effect on an individual portfolio depends on its actual investments.
The November 5 record does not prove that Philippine financial markets face an imminent collapse.
Nor does it establish that every overseas investment should be sold.
The broader lesson is to understand investment concentration, leverage and the potential consequences of rapid market movements.
Three Scenarios for Wall Street After the Options Frenzy
Scenario 1: Markets stabilize and recover.
If selling pressure eases and investors regain confidence in corporate earnings, stocks could recover part of their recent losses.
High options volume may then be remembered as a sign of extreme short-term fear.
Scenario 2: Volatility remains elevated.
Investors may continue adjusting positions while uncertainty persists over AI spending, government policy and interest rates.
Large daily movements could continue without producing a sustained crash.
Scenario 3: The market selloff deepens.
If technology valuations decline further and leveraged investors continue reducing exposure, additional selling could affect broader equity markets.
The record options volume does not establish which scenario will occur.
Investors will need to monitor market liquidity, earnings, economic data and derivatives positioning.
The Bigger Question: Is Wall Street’s Record Options Volume a Warning or a Turning Point?
The November 5 trading session exposed the extraordinary level of uncertainty gripping American financial markets.
More than 112 million options contracts changed hands.
Put trading exceeded call trading.
The Nasdaq 100 plunged 6.4%.
The S&P 500 lost 4.4%.
And the VIX surged to its highest level in eight months.
These developments reflected a sudden reversal from the optimism that initially followed the US midterm elections.
They also revealed how deeply investors remain exposed to the future of artificial intelligence.
For some traders, the record options volume represents a warning that market conditions could become more unstable.
For others, the extreme fear and Friday’s partial recovery suggest that the worst of the immediate selling pressure may have passed.
The evidence confirms a historic surge in options trading and an exceptionally volatile stock-market session. It does not confirm that another crash is inevitable—or that a lasting recovery has begun.
The direction of Wall Street will depend on whether businesses can justify their valuations, whether investors maintain confidence in the AI economy and how global financial conditions evolve.
And as traders recover from a record-breaking rush to buy and sell options, one question now dominates the market: Was November 5 the beginning of a much bigger Wall Street reckoning—or the moment when panic reached its peak before an unexpected recovery?